Let us look at the differences between effects and dummy coding for regression models with categorical predictors.
Model with one categorical factor
Let us simulate some data first, for \(n = 10\) subjects and a group predictor with levels ctr for the control group and trt for the treatment group.
dat <-data.frame(id =factor(1:10),group =factor(c("ctr", "trt")),resp =c(rnorm(5, mean =1), rnorm(5)))aggregate(resp ~ group, data = dat, FUN = mean)
  group       resp
1   ctr  0.2609670
2   trt -0.1312885
Per default R uses so-called dummy coding to represent factors. This means that the reference category (here ctr) is set to 0 and the second category is set to 1. R takes the first factor level as reference category in dummy coding.
contrasts(dat$group)
    trt
ctr   0
trt   1
You can check the default settings of your R session with
options()$contrasts
        unordered           ordered
"contr.treatment"      "contr.poly"
The first entry "contr.treatment" indicates dummy coding.
Linear model with dummy coding
Let us now fit a simple linear regression
\[resp = \beta_0 + \beta_1 group + \varepsilon\]
with \(\varepsilon \sim N(0,\sigma_{\varepsilon})\).
(For a two-level between factor, this is equivalent to an independent t-test.)
lm1 <-lm(resp ~ group, data = dat)summary(lm1)
Call:
lm(formula = resp ~ group, data = dat)

Residuals:
    Min      1Q  Median      3Q     Max
-1.5820 -0.4338 -0.1752  0.6928  1.6374

Coefficients:
            Estimate Std. Error t value Pr(>|t|)
(Intercept)   0.2610     0.4451   0.586    0.574
grouptrt     -0.3923     0.6295  -0.623    0.551

Residual standard error: 0.9953 on 8 degrees of freedom
Multiple R-squared:  0.0463,    Adjusted R-squared:  -0.07292
F-statistic: 0.3883 on 1 and 8 DF,  p-value: 0.5505
coef(lm1)[1] # mean ctr
(Intercept)
   0.260967
sum(coef(lm1)) # mean trt
[1] -0.1312885
The interpretation of the parameters is straightforward: The Intercept \(\beta_0\) is the mean response in the control (here the reference) group \((\bar x_{ctr} = \beta_0)\) and \(\beta_1\) is the difference between the control and the treatment group \((\bar x_{trt} = \beta_0 + \beta_1)\).
Linear model with effects coding
Next, we will fit the same model with effects coding. Hereby, the reference group is coded as \(-1\).
You can see that for effects coding, R takes the last factor level as reference category.
Now, let us refit the model.
lm2 <-lm(resp ~ group, dat)summary(lm2)
Call:
lm(formula = resp ~ group, data = dat)

Residuals:
    Min      1Q  Median      3Q     Max
-1.5820 -0.4338 -0.1752  0.6928  1.6374

Coefficients:
            Estimate Std. Error t value Pr(>|t|)
(Intercept)  0.06484    0.31473   0.206    0.842
group1       0.19613    0.31473   0.623    0.551

Residual standard error: 0.9953 on 8 degrees of freedom
Multiple R-squared:  0.0463,    Adjusted R-squared:  -0.07292
F-statistic: 0.3883 on 1 and 8 DF,  p-value: 0.5505
sum(coef(lm2)) # mean ctr
[1] 0.260967
-diff(coef(lm2)) # mean trt
    group1
-0.1312885
In this model, the Intercept \(\beta_0\) is now the overall mean (often called the grand mean).
mean(dat$resp)
[1] 0.06483924
And \(\beta_1\) is the difference of the mean in group 1 (here the control group) to the overall mean and its negative value is the difference of group 1 (treatment group) to the overall mean.
Model with two categorical factors
Let us again simulate some data first. This time for \(n = 20\) subjects, a group predictor like before and an additional factor study with two levels s1 and s2.
dat <-data.frame(id =factor(1:20),group =factor(rep(c("ctr", "trt"), each =10)),study =factor(rep(c("s1", "s2"), each =5)),resp =c(rnorm(10, mean =1),rnorm(5, mean =0.5),rnorm(5)))aggregate(resp ~ group + study, data = dat, FUN = mean)
  group study       resp
1   ctr    s1  1.0575195
2   trt    s1  0.9622200
3   ctr    s2  1.2211857
4   trt    s2 -0.2307511
mean(dat$resp)
[1] 0.7525435
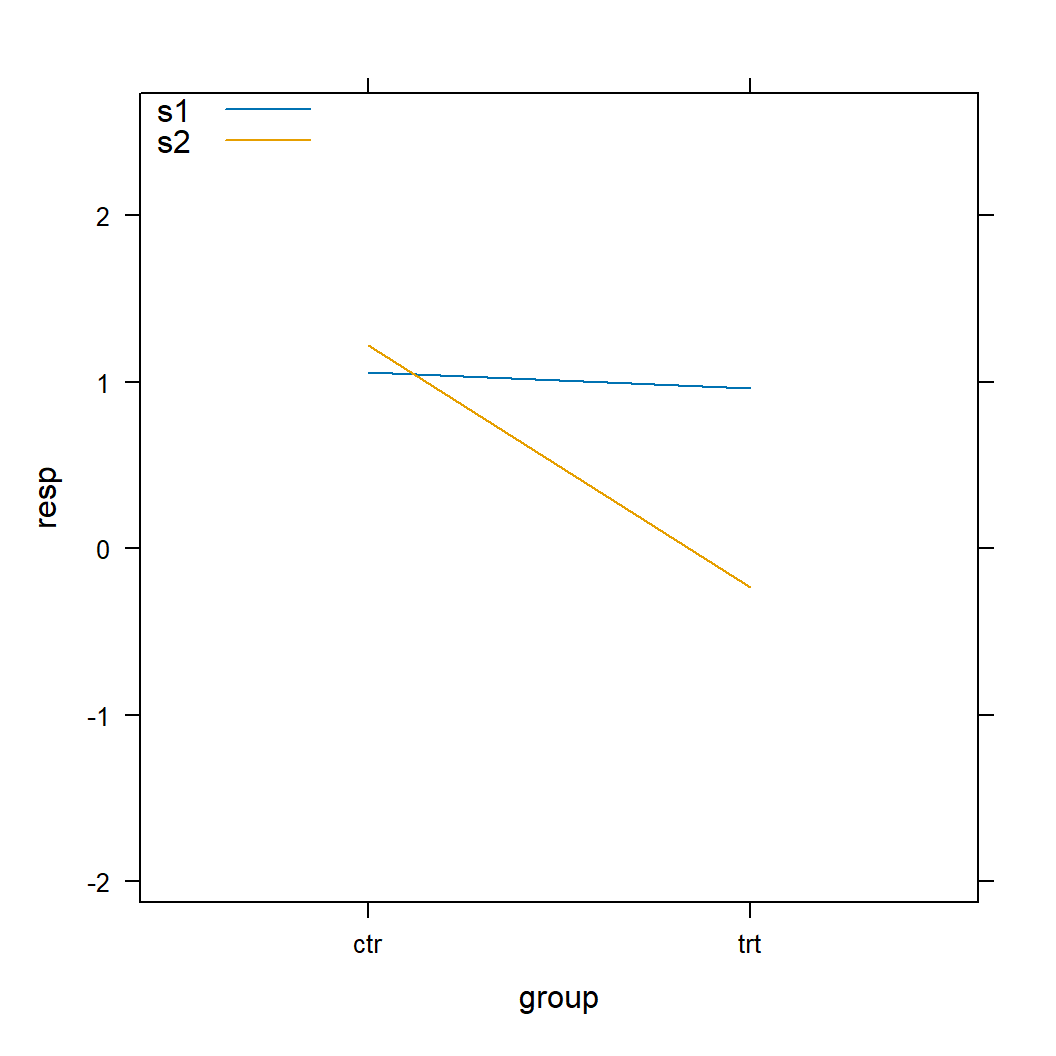
lattice::xyplot(resp ~ group, data = dat, groups = study, type ="a",auto.key =list(corner =c(0, 1)))
Both factors are now dummy coded, since we did not tell R to do otherwise.
contrasts(dat$group)
    trt
ctr   0
trt   1
contrasts(dat$study)
   s2
s1  0
s2  1
Linear model with dummy coding
Let us now fit regression model with an interaction term
\[resp = \beta_0 + \beta_1 group + \beta_2 study + \beta_3 (group \times
study) + \varepsilon\]
with \(\varepsilon \sim N(0,\sigma_{\varepsilon})\).
(This is equivalent to a 2x2 ANOVA with two between factors.)
lm3 <-lm(resp ~ group * study, data = dat)summary(lm3)
Call:
lm(formula = resp ~ group * study, data = dat)

Residuals:
     Min       1Q   Median       3Q      Max
-1.59696 -0.61529  0.00399  0.56974  1.86454

Coefficients:
                 Estimate Std. Error t value Pr(>|t|)
(Intercept)        1.0575     0.4582   2.308   0.0347 *
grouptrt          -0.0953     0.6480  -0.147   0.8849
studys2            0.1637     0.6480   0.253   0.8038
grouptrt:studys2  -1.3566     0.9165  -1.480   0.1582
---
Signif. codes:  0 '***' 0.001 '**' 0.01 '*' 0.05 '.' 0.1 ' ' 1

Residual standard error: 1.025 on 16 degrees of freedom
Multiple R-squared:  0.2826,    Adjusted R-squared:  0.1481
F-statistic: 2.101 on 3 and 16 DF,  p-value: 0.1404
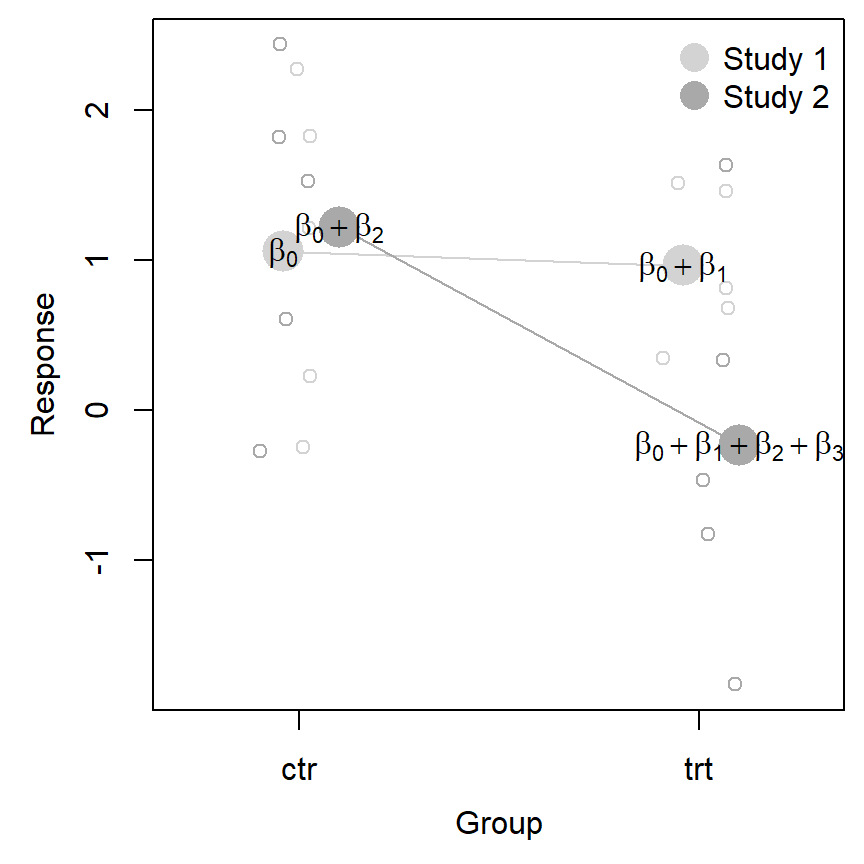
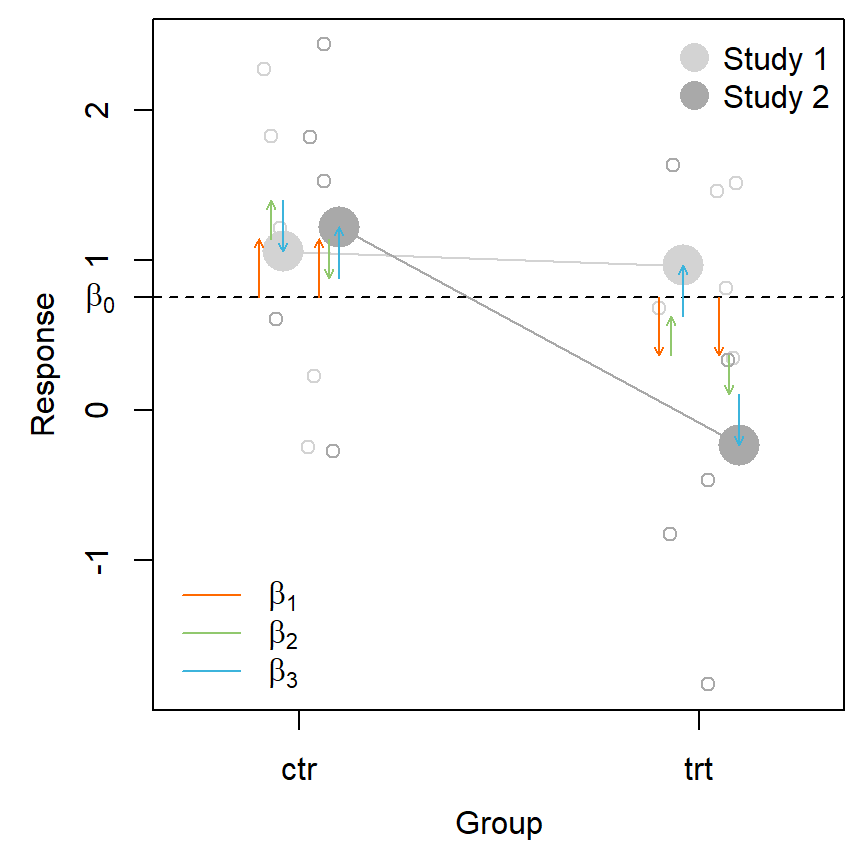
We can now reconstruct the mean values for all four groups with our parameters. The Intercept \(\beta_0\) is now the mean response in study 1 for the control group.
With dummy coding, we can think of the dummy variables as “controlling” which parameters are entered into the mean calculations and which are not. With only categorical predictors, we get a separate equation for each of the four group means.